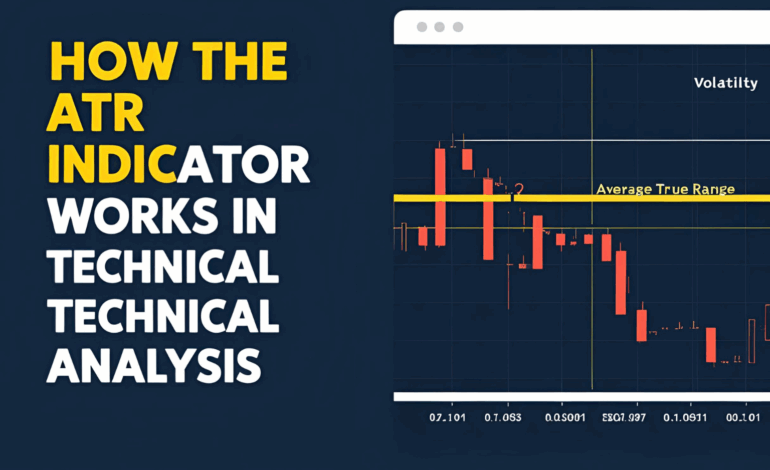
How the ATR Indicator Works in Technical Analysis
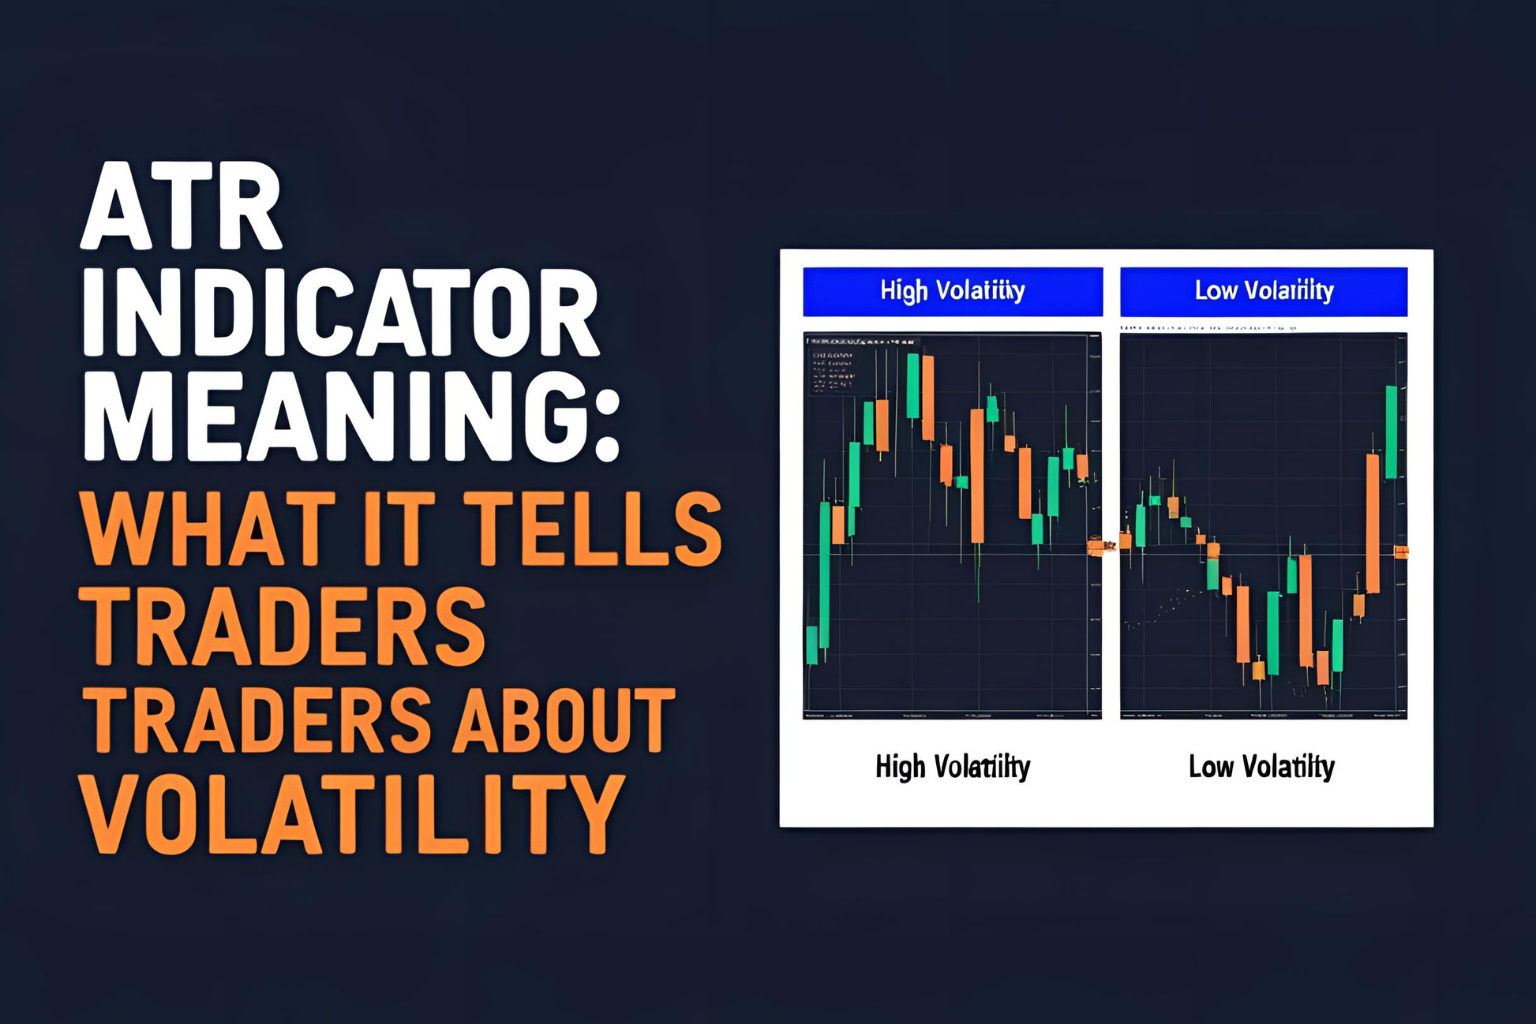
The ATR (Average True Range) is a volatility-based indicator that helps traders measure how much an asset moves within a specific period. It doesn’t predict direction but provides valuable insight into price activity and market strength. Understanding how the ATR indicator works can significantly improve your trade management and decision-making.
What Does the ATR Indicator Measure?
The ATR calculates the average of true ranges over a set number of periods, commonly 14. The true range considers price gaps and volatility spikes, not just the high and low of the current candle.
The True Range (TR) is the greatest of:
- Current High − Current Low
- |Current High − Previous Close|
- |Current Low − Previous Close|
Then, ATR is calculated as a moving average of these true ranges over the chosen period.
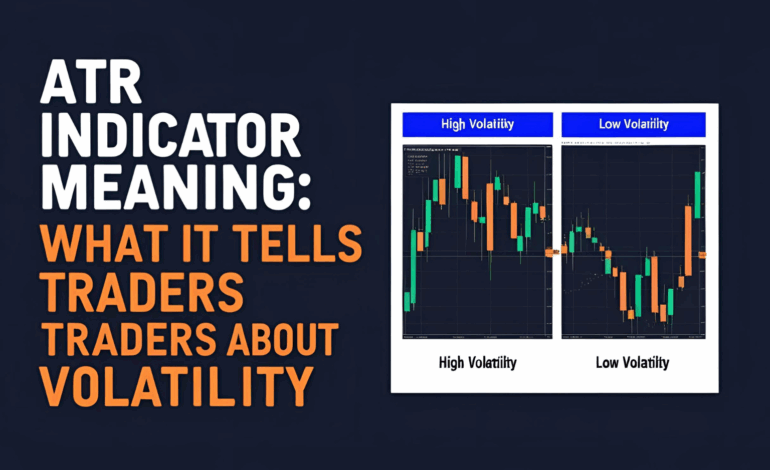
How to Read the ATR on a Chart
- The ATR is typically plotted below the price chart as a line graph.
- A rising ATR line means the market is becoming more volatile.
- A falling ATR line means the market is calming down.
For example, if the ATR line moves from 1.2 to 2.6, it means price candles are getting larger on average—signaling increased market activity.
Why Is ATR Useful in Technical Analysis?
1. Risk Management
Traders use ATR to set dynamic stop-loss and take-profit levels that adjust to market volatility.
2. Volatility Confirmation
ATR helps validate breakouts or trend continuation by confirming whether price action is strong enough.
3. Position Sizing
ATR-based systems can help you decide how much to invest based on volatility. Higher ATR = smaller position to maintain consistent risk.
Example Use Case
You’re trading a stock with:
- Entry: $500
- ATR(14): $5
- Strategy: Stop-loss = 1.5× ATR
Then your stop-loss is:
$500 − (1.5 × $5) = $492.5
This approach automatically adjusts your risk based on how volatile the asset is.
Timeframes and Instruments
- Works across any timeframe—from 1-minute charts to weekly
- Effective in stocks, forex, crypto, and commodities
- Particularly useful during news events, breakouts, or high volatility periods
Limitations to Keep in Mind
- ATR does not indicate trend direction
- Doesn’t provide buy or sell signals
- used as part of a broader strategy
Conclusion
The ATR indicator works by giving traders a clear view of market volatility. It doesn’t tell you where the price will go—but it tells you how far it might move, which is just as critical. Mastering ATR allows for smarter entries, tighter risk control, and better alignment with real-time market conditions.
✅ FAQs
1. How does the ATR indicator calculate volatility?
It averages the true range of price movements over a set number of periods.
2. Can ATR help in placing stop-loss orders?
Yes, it’s commonly used to set volatility-adjusted stop-loss levels.
3. Does ATR show when to buy or sell?
No, it only reflects volatility and should be paired with other indicators.
4. Is ATR good for all markets?
Yes, ATR works well in stocks, forex, crypto, and futures.
5. What’s a typical ATR period?
14 periods is the most commonly used setting, but traders may adjust it.