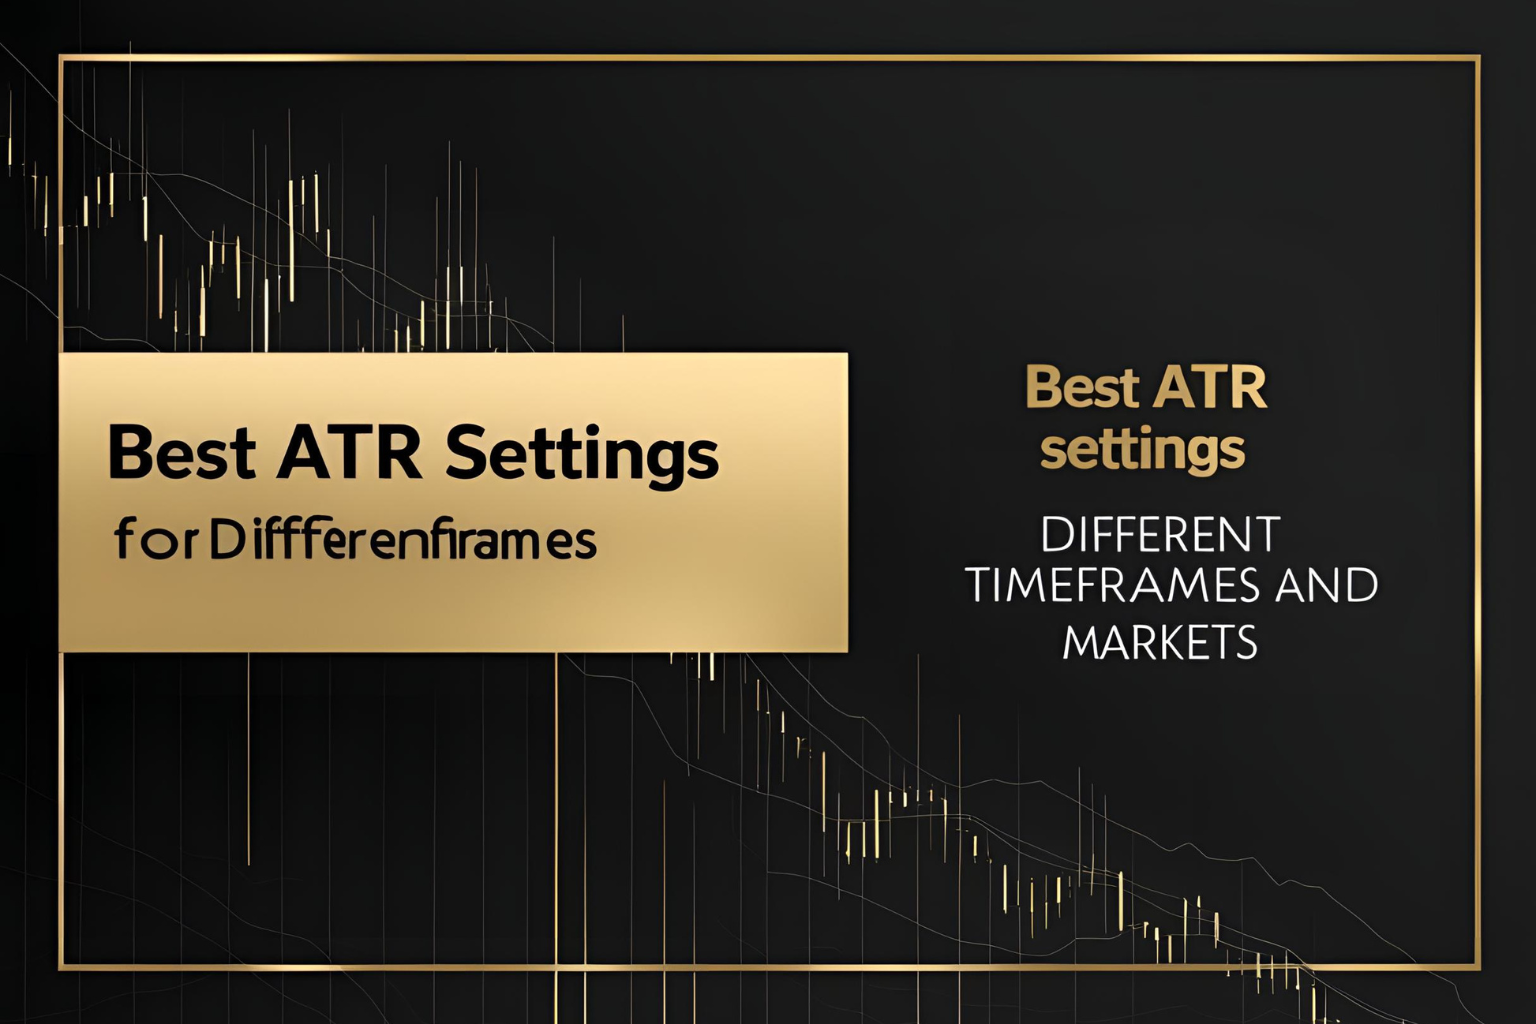
Best ATR Settings for Different Timeframes and Markets
Choosing the best ATR settings depends on your trading style, market, and timeframe. While the default ATR period is 14, it’s not a one-size-fits-all number. Traders adjust the ATR settings to better reflect volatility in different market conditions. This guide will help you
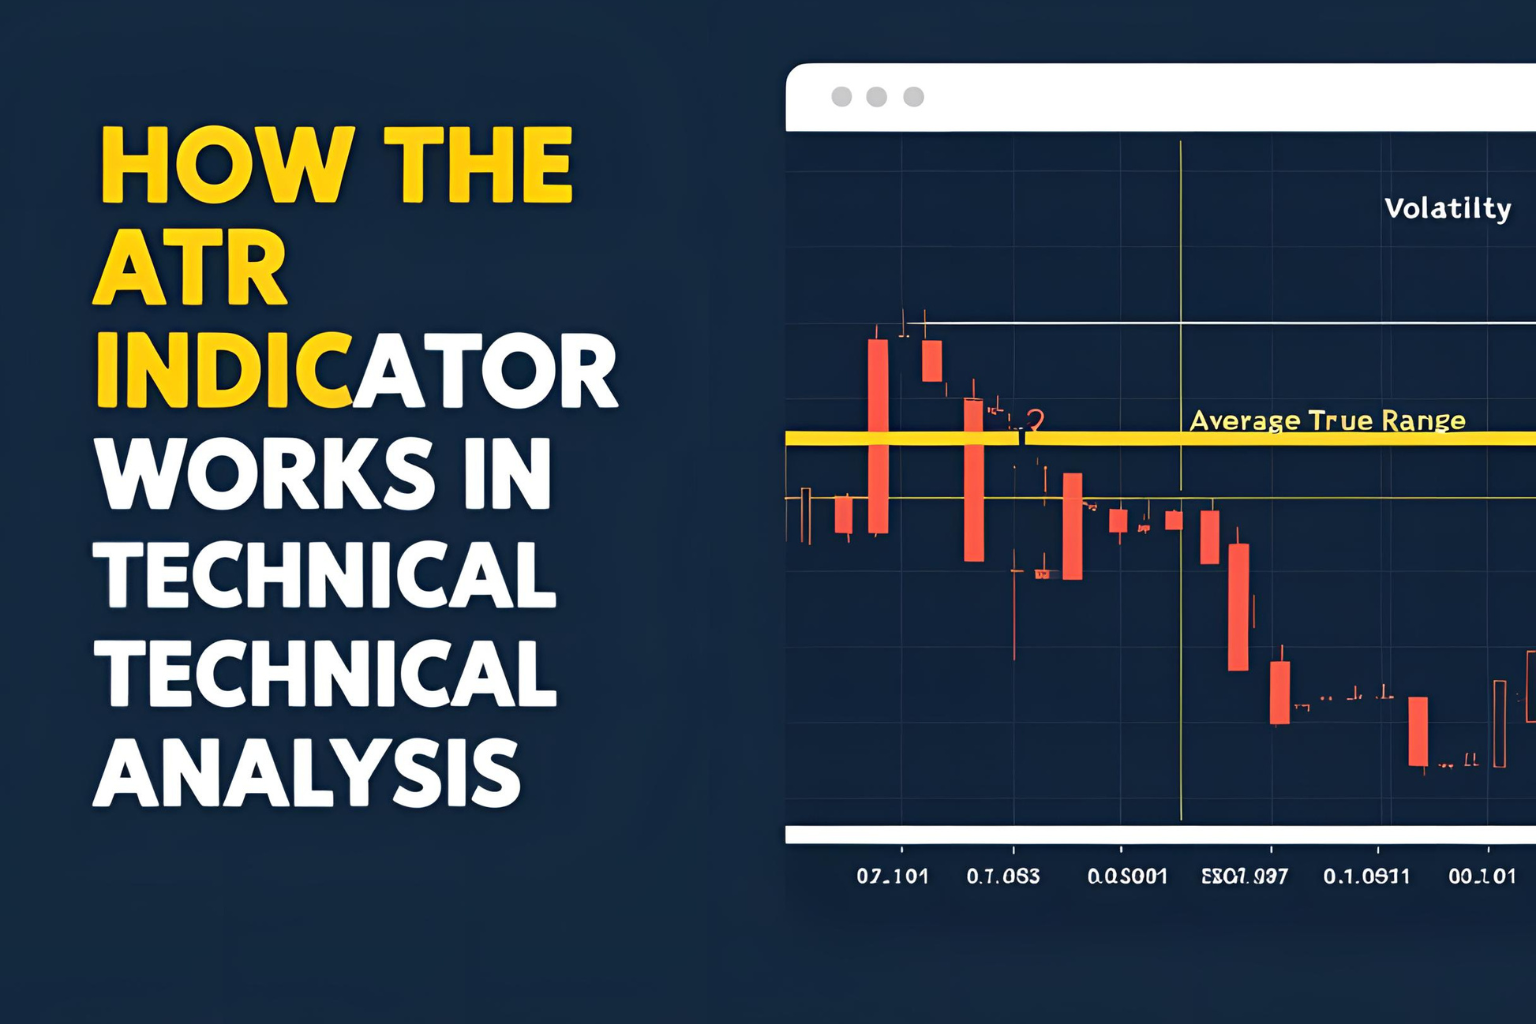
How the ATR Indicator Works in Technical Analysis
The ATR (Average True Range) is a volatility-based indicator that helps traders measure how much an asset moves within a specific period. It doesn’t predict direction but provides valuable insight into price activity and market strength. Understanding how the ATR indicator works can
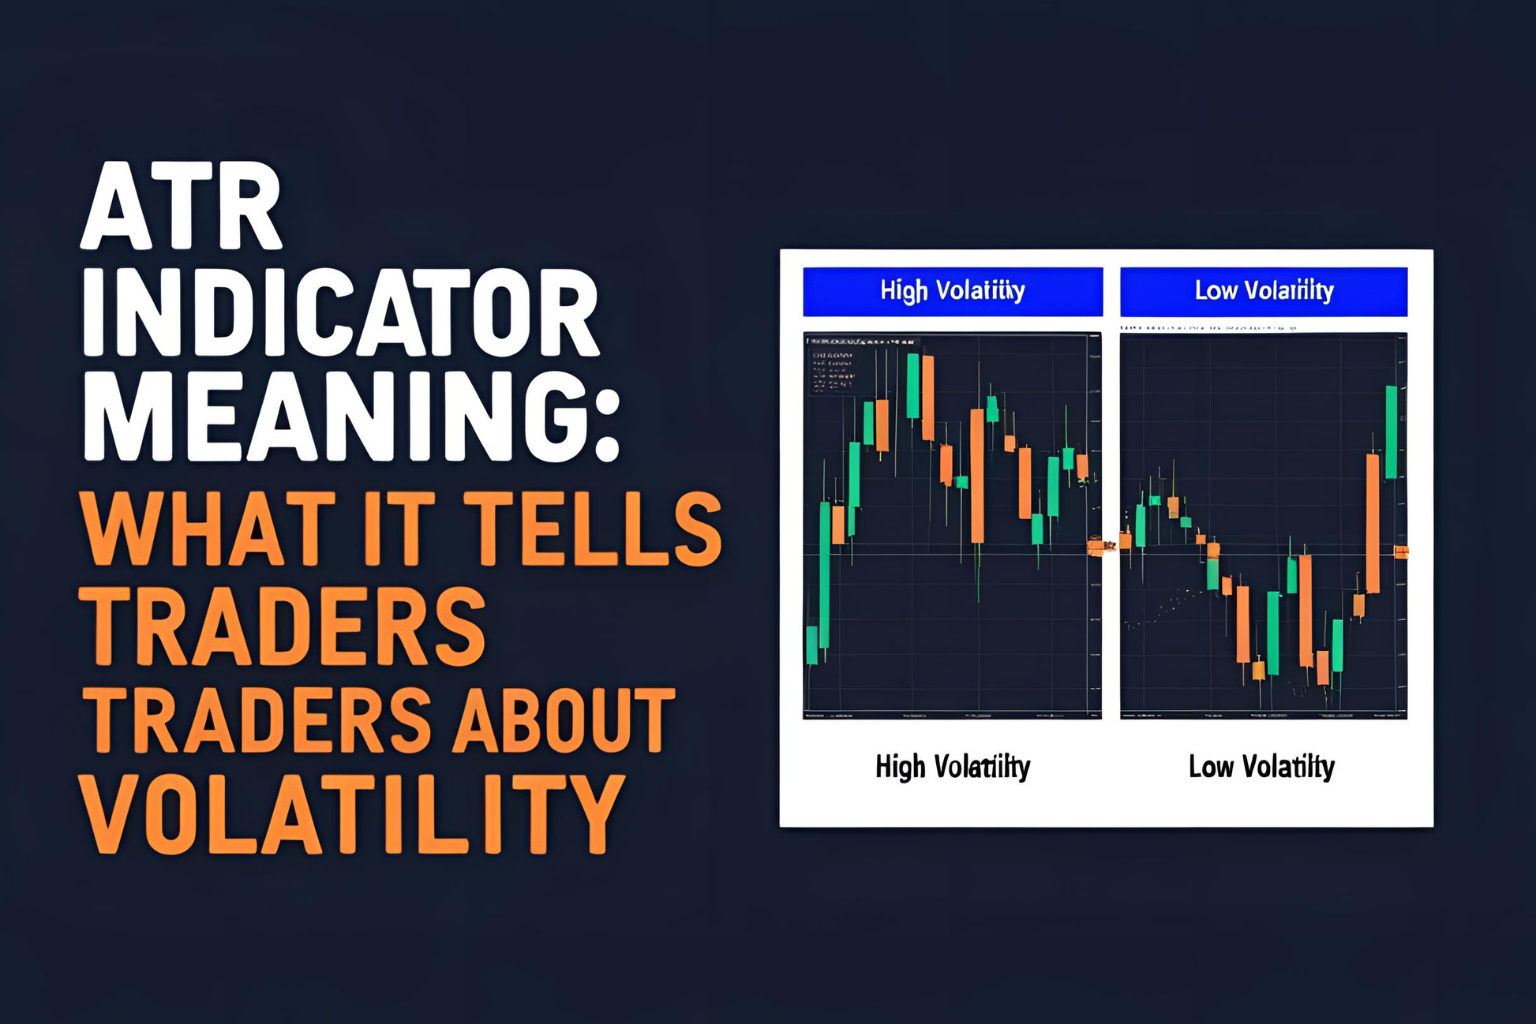
ATR Indicator Meaning: What It Tells Traders About Volatility
The ATR indicator, or Average True Range, measures how much an asset moves on average during a specific period. It does not indicate the direction of price movement—only its volatility. This makes it especially useful in determining the strength of a price move
ATR Indicator Formula Explained with Simple Examples
The ATR indicator formula helps traders calculate market volatility based on price movements. It uses the True Range (TR) as its foundation and provides a smooth average of this range over a selected period. Let’s break down the steps and walk through an
What Is the ATR Indicator? A Beginner’s Guide
The ATR indicator, or Average True Range, is a technical analysis tool used to measure market volatility. It was introduced by J. Welles Wilder Jr. in his 1978 book “New Concepts in Technical Trading Systems.” Unlike many indicators that focus on price direction,