
ATR Indicator Strategy for Intraday and Swing Trading
The ATR indicator strategy is a volatility-based method that helps traders optimize their entries, stop-losses, and targets based on how much price typically moves. Since the ATR (Average True Range) reflects market volatility, it’s ideal for both intraday traders looking for quick setups
Using the ATR Indicator on NinjaTrader: A Quick Tutorial
The ATR indicator (Average True Range) is included by default in NinjaTrader, a powerful trading platform widely used for futures, forex, and stock markets. It helps traders measure market volatility and set precise stop-loss and target levels. In this quick tutorial, you’ll learn
How to Add and Use the ATR Indicator in ThinkorSwim (TOS)
The ThinkorSwim (TOS) platform by TD Ameritrade is a powerful trading tool with advanced charting capabilities. It comes with the ATR (Average True Range) indicator built in, making it easy to measure market volatility and improve your trading decisions. This step-by-step guide will
ATR Indicator Setup Guide for MT4 and MT5 Users
The ATR indicator is built into both MetaTrader 4 (MT4) and MetaTrader 5 (MT5) platforms, widely used in forex and CFD trading. This step-by-step guide shows how to add the ATR indicator in MT4/MT5, adjust its settings, and use it to manage your
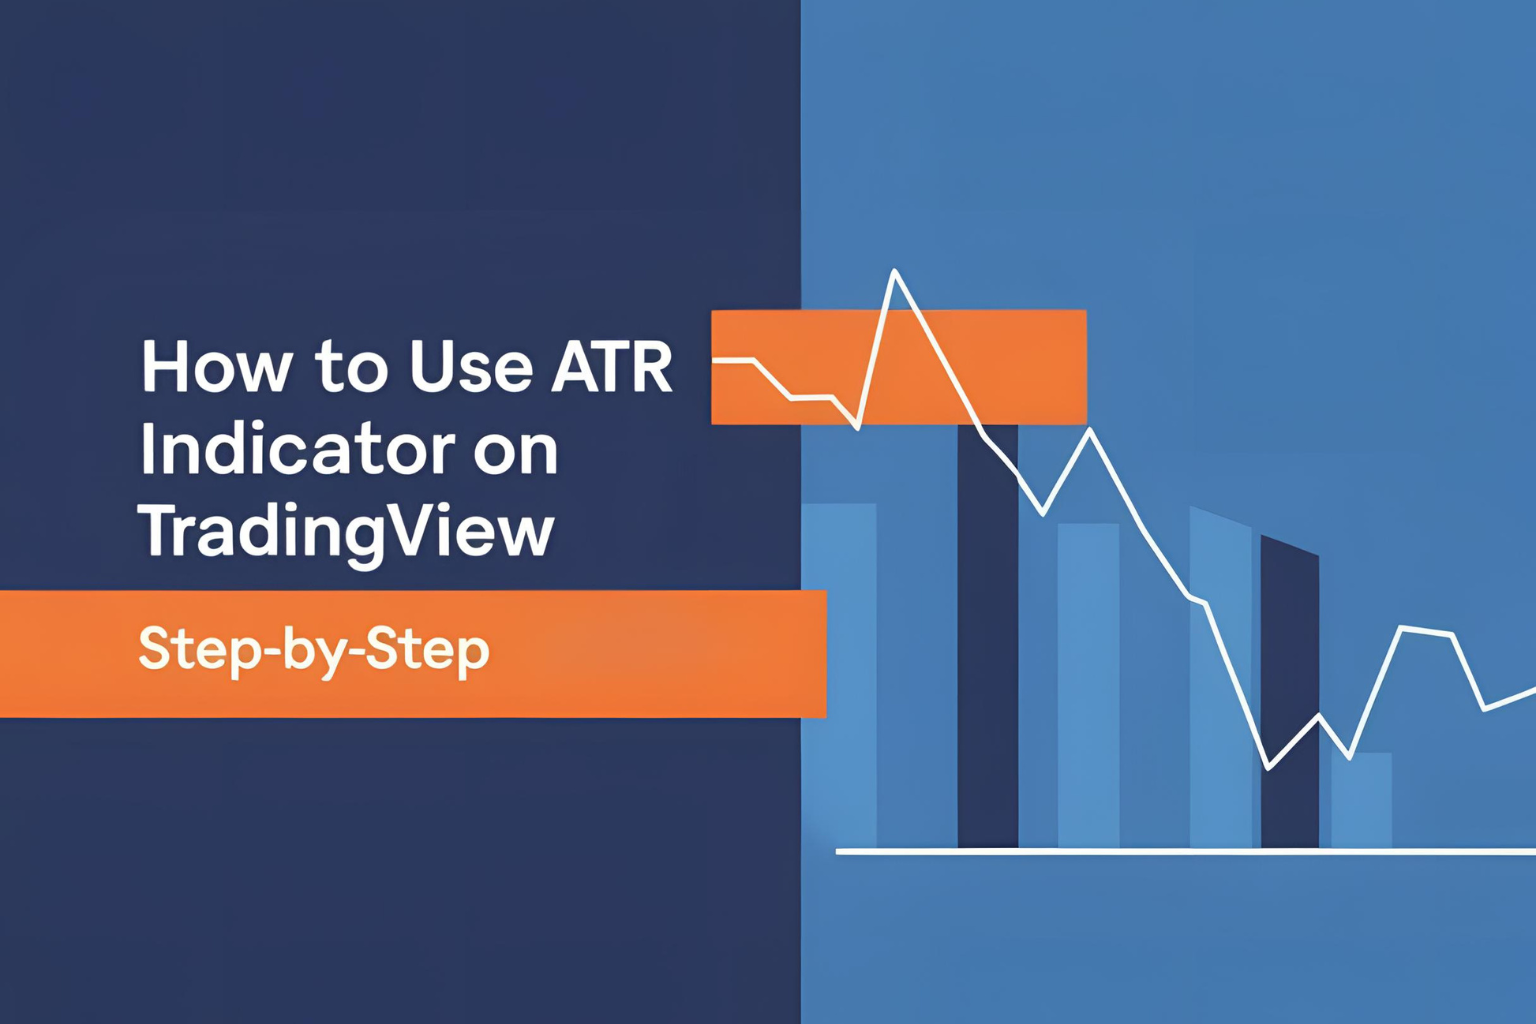
How to Use ATR Indicator on TradingView (Step-by-Step)
The ATR indicator is built into TradingView, one of the most popular charting platforms for traders. Whether you trade stocks, forex, crypto, or futures, using the ATR on TradingView can help you visualize volatility and set smarter stops and targets. In this guide,
Best ATR Settings for Different Timeframes and Markets
Choosing the best ATR settings depends on your trading style, market, and timeframe. While the default ATR period is 14, it’s not a one-size-fits-all number. Traders adjust the ATR settings to better reflect volatility in different market conditions. This guide will help you
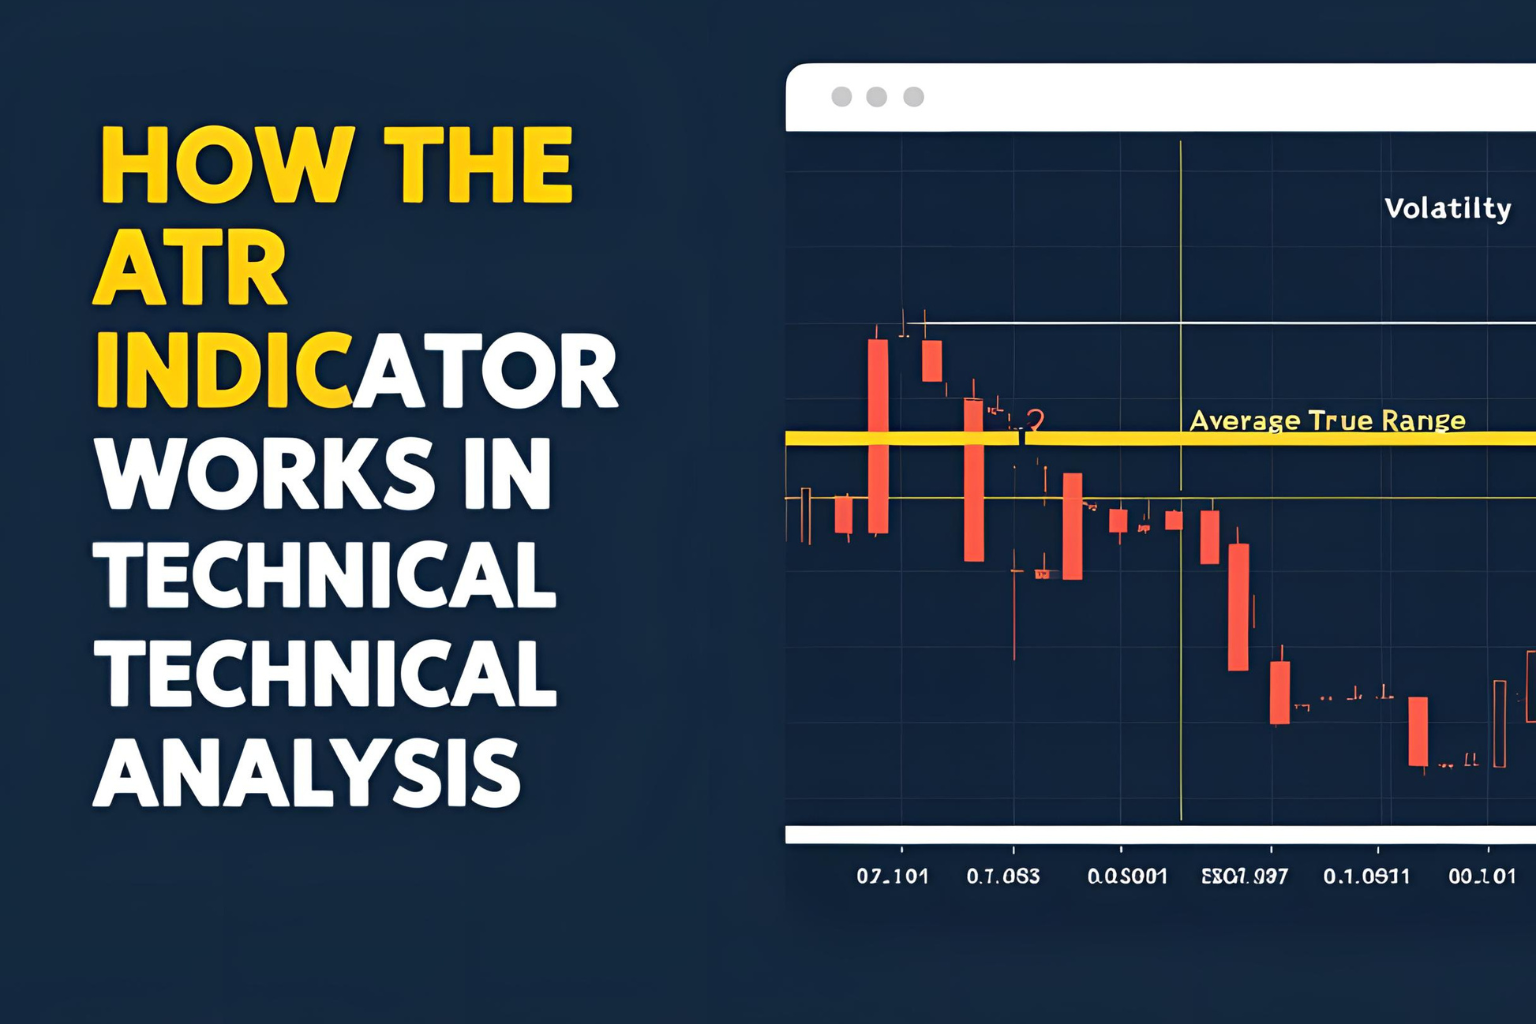
How the ATR Indicator Works in Technical Analysis
The ATR (Average True Range) is a volatility-based indicator that helps traders measure how much an asset moves within a specific period. It doesn’t predict direction but provides valuable insight into price activity and market strength. Understanding how the ATR indicator works can
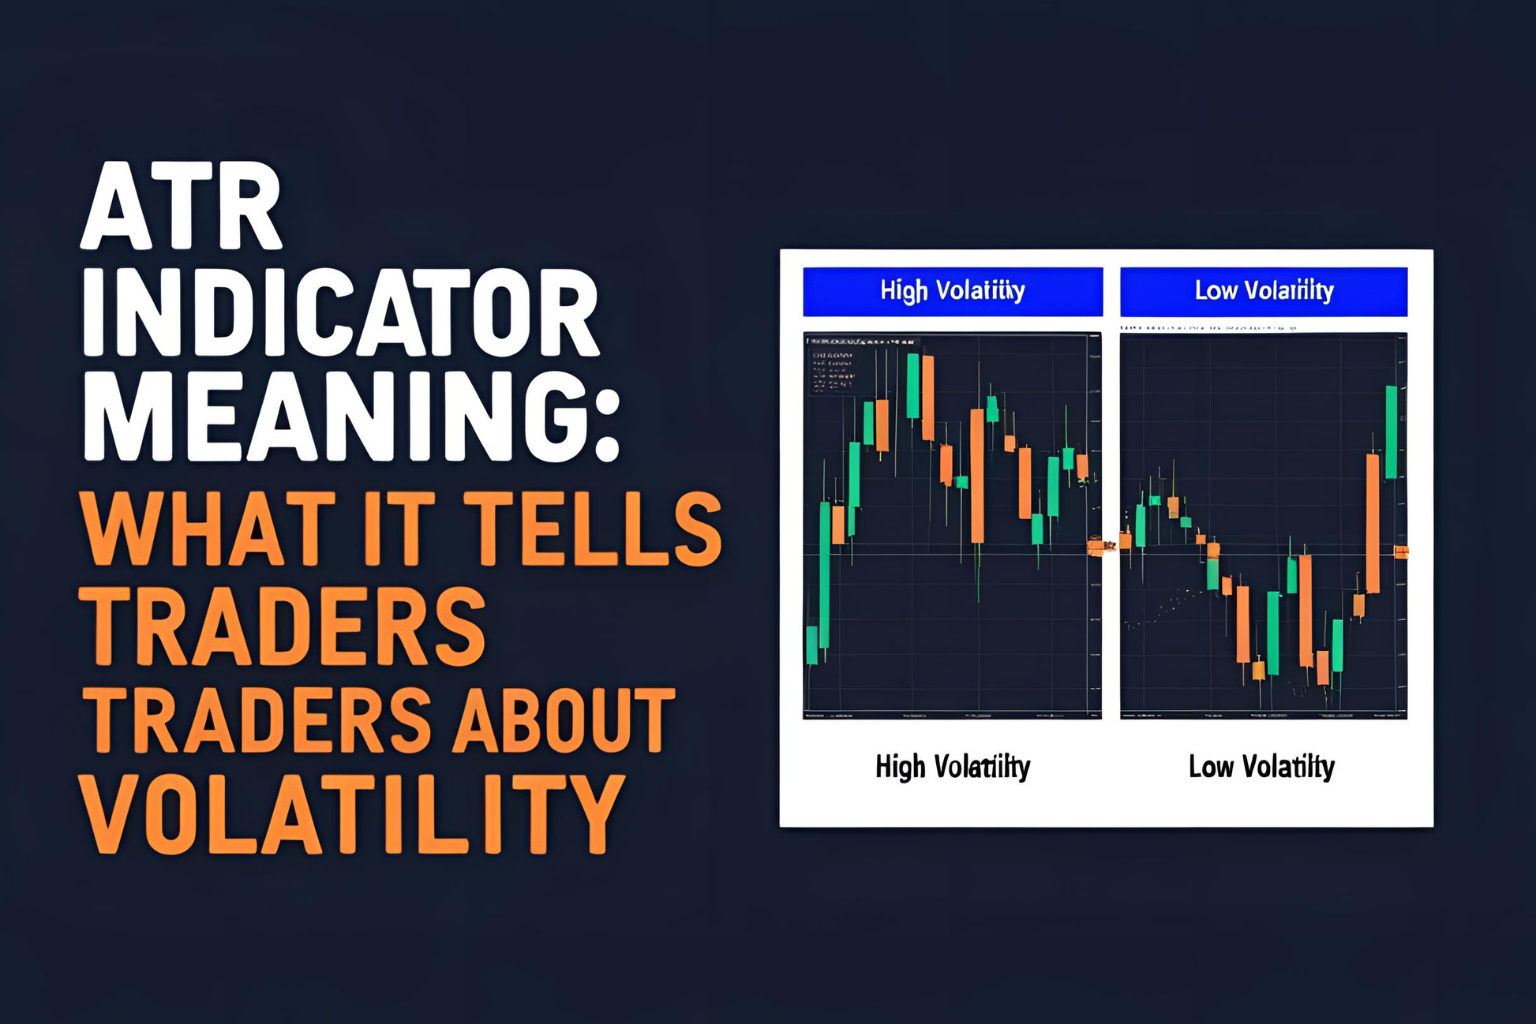
ATR Indicator Meaning: What It Tells Traders About Volatility
The ATR indicator, or Average True Range, measures how much an asset moves on average during a specific period. It does not indicate the direction of price movement—only its volatility. This makes it especially useful in determining the strength of a price move
ATR Indicator Formula Explained with Simple Examples
The ATR indicator formula helps traders calculate market volatility based on price movements. It uses the True Range (TR) as its foundation and provides a smooth average of this range over a selected period. Let’s break down the steps and walk through an
What Is the ATR Indicator? A Beginner’s Guide
The ATR indicator, or Average True Range, is a technical analysis tool used to measure market volatility. It was introduced by J. Welles Wilder Jr. in his 1978 book “New Concepts in Technical Trading Systems.” Unlike many indicators that focus on price direction,